")
")
| Issue |
Mov Sport Sci/Sci Mot
Number 106, 2019
|
|
|---|---|---|
| Page(s) | 37 - 44 | |
| DOI | https://doi.org/10.1051/sm/2019017 | |
| Published online | 04 July 2019 | |
Article
Repeat trial and breath averaging: Recommendations for research of VO2 kinetics of exercise transitions to steady-state
Répéter l’essai et souffle en moyenne : recommandations pour la recherche de la cinétique de la VO2 de l’exercice de transitions vers l’état d’équilibre
Office 416, O Block (A Wing), Queensland University of Technology,
4065
Kelvin Grove, Australia
* Corresponding author: c.mcnulty@qut.edu.au
Received:
18
February
2019
Accepted:
24
May
2019
Multiple-breath and multiple-trial averaging have been used extensively in research of oxygen uptake kinetics to steady-state. However, specific guidelines outlining correct levels of averaging have not been discussed. The aim of this study was to assess error differences using multiple-trial and multiple-breath averaging systems, and make recommendations for future VO2 kinetics research. Eight male subjects were recruited for this study. Following a maximal cycle test to ascertain each subject’s ventilation threshold, eight identical repetition cycling exercise bouts were administered. The bouts consisted of 6-minute at 85% of the subject’s ventilation threshold. Firstly, multiple-trial and multiple-breath data were processed using traditional methods. As well, data were fit using a mono-exponential model to derive tau. Data for all levels of multiple-trial and multiple-breath methods were compared to an 8-trial and 13-breath average, respectively. Reduction in error from the 3-trial average and a 3-breath average represented ∼68% and ∼70% of total error reduction, respectively. Tau tended to increase with increasing breath averaging and decrease with increasing trial averaging. There is negligible benefit to averaging more than 3 repeat trials in VO2 kinetics research. Breath averaging beyond 3-breaths artificially increases tau.
Résumé
La moyenne de plusieurs cycles respiratoires et la répétition des essais sont très utilisées dans le domaine de la recherche sur la cinétique de la consommation d’oxygène (VO2) vers l’état d’équilibre. Cependant, les recommandations spécifiques décrivant les méthodes correctes de calcul de la moyenne n’ont pas été discutées. Le but de cette étude était d’évaluer les différences d’erreur à l’aide de systèmes de calcul de la moyenne sur plusieurs essais et sur plusieurs cycles respiratoires, et de formuler des recommandations pour les études futures sur le cinétique de VO2. Huit sujets masculins ont été recrutés pour cette étude. Après un test maximal sur ergocycle pour déterminer le seuil ventilatoire de chaque sujet, huit séances d’exercices cyclistes, répétées à l’identique, ont été effectuées. Les tests consistaient en 6 minutes à 85 % du seuil de ventilatoire du sujet. Les données d’essais et de cycles respiratoires multiples ont été traitées à l’aide de méthodes traditionnelles. Les données ont été ensuite ajustées à l’aide d’un modèle mono-exponentiel pour dériver « tau ». Les données d’essais et de cycles respiratoires multiples ont été comparées à une moyenne de 8 essais et à une moyenne de 13 cycles respiratoires. La réduction de l’erreur par rapport à la moyenne des 3 essais et à la moyenne des 3 cycles respiratoires représentait respectivement environ 68 et 70 % de la réduction totale des erreurs. La valeur « tau » avait tendance à augmenter avec l’augmentation de la moyenne des cycles respiratoires et à diminuer avec la moyenne des essais. Il existe un avantage négligeable à moyenner plus de 3 essais pour l’étude de la cinétique de VO2. De même, la moyenne des cycles au-delà de 3 cycles respiratoires augmente artificiellement le « tau ».
Key words: cycle ergometer / data averaging / indirect calorimetry / oxygen uptake / mono-exponential
Mots clés : cyclo-ergomètre / calcul de moyenne / calorimétrie indirecte / consommation d’oxygène / mono-exponentielle
© ACAPS, 2020
1. Introduction
A wealth of research in oxygen uptake (VO2) kinetics to steady-state over the past three decades have used averaged breath-by-breath data from multiple repeat trials (Barstow, Casaburi, & Wasserman, 1993; Carter, Pringle, Jones, & Doust, 2002; Spencer, Murias, Grey, & Paterson, 2012; Whipp, Ward, Lamarra, Davis, & Wasserman, 1982). Prior to this, multiple-breath averaging was used as the primary method of VO2 data processing (Diamond, Casaburi, Wasserman, & Whipp, 1977; Hagberg, Hickson, Ehsani, & Holloszy, 1980; Hickson, Bomze, & Holloszy, 1978).
Multiple-trial averaging involves subjects often completing two to eight exercise repetitions of a study’s protocol(s). The subject’s breath-by-breath VO2 data for each of the repetitions is interpolated at 1 s intervals, then temporarily aligned to a signal that marks the onset of the exercise transition before averaging the signal across the multiple trials. The averaged VO2 data is then fit with a mono-exponential model [Eq. (1)]. The model is as follows:
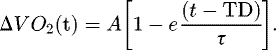 (1)
(1)
For Eq. (1), A is the amplitude of the exponential process; TD represents the time at which the exponential asymptote most closes approaches, or crosses, the pre-transition steady-state value (if a time delay is chosen to be used); and τ (tau) is the time constant of the response.
In addition to multiple-trial averaging, breath-averaging has been used to remove data variability (Diamond et al., 1977; Hagberg et al., 1980; Hickson et al., 1978; McNulty, Robergs, & Morris, 2015). Commonly a 3-, 5-, or 7-breath average has been used, where the central breath of the pre-selected breath-average becomes the focal point of the average of the breaths either side. For example, if a 7-breath average is chosen, then the 4th breath will become the calculated average of the 3 breaths either side (mathematically: x = [n – 1] / 2; where n equals the pre-selected breath-average, and x equals the number of data points either side of the central breath to be averaged). This averaging technique will continue for every data point (or breath), resulting in the removal of x data points from the beginning and end of the averaged data set. Despite breath-averaging and in more recent decades, trial-averaging, being used systematically in post-acquisition processing of VO2 kinetics for many years, no prior comparative assessment of these two methodologies has been performed.
Given the limited empirical evidence for the data processing used in research of VO2 kinetics during exercise transitions to steady-state, the purpose of this study was to:
-
assess the altered data variability and VO2 kinetics for exercise transitions to steady-state of single vs. multiple trial-averaged exercise transitions;
-
assess the altered data variability and VO2 kinetics for exercise transitions to steady-state of raw vs. multiple breath-averaged exercise transitions.
In addition, recommendations for data acquisition and processing will be made depending on the results of this study.
2. Materials and methods
2.1. Participants
Eight male subjects (mean age = 25 ± 5.9 years; height = 179.7 ± 7.3 cm; weight = 81.2 ± 6.6 kg) were recruited and completed the exercise trials of this study. The criteria for recruitment were healthy males aged between 18 and 35 years. Each participant was recruited on a basis of self-reported physical fitness (the minimum requirements for recruitment purposes were current endurance training for at least 45 minutes, 3 times per week), with a measured VO2 ≥ 40 mL/kg/min. All participants were asked to complete an Exercise and Sports Science Australia: Adult Pre-Screening System (Exercise and Sports Science Australia, 2011) tool to determine that they were in good physical health with no musculoskeletal disorders or risk factors for sedentary lifestyle diseases. Written informed consent was obtained from each participant prior to data collection and all methods were approved by the institution’s Human Research Ethics Committee.
2.2. Familiarisation and baseline testing
After completion of informed consent, a familiarization session, as well as a VO2 maximum ramp protocol cycle ergometer test, were administered for each participant. During the familiarization session, the subject’s height and mass were recorded, and the cycle ergometer’s (Excalibur Sport, LODE) seating and handle bar arrangement were adjusted for each subject’s preference and biomechanical needs. These adjustments were recorded and maintained for all future bouts. Before exercising, the subjects were asked to remain seated for 5 mins in order to ascertain a resting heart rate (HR) measure. The subjects were then asked to cycle at 100 W for several minutes until they had established a comfortable, and constant pedalling cadence. It was explained the clients that a cadence of 80–105 rpm. This cadence was the set point for the entirety of the testing for that individual subject.
Methods for the collection data for ECG (CASE Exercise Testing System, General Electric) and expired gases (S-3A Oxygen Analyzer and CD-3A Carbon Dioxide Analyzer, AEI Technologies) during the VO2 max test and subsequent trials have been described previously in McNulty et al. (2015).
Administration of the VO2 ramp test had the subject cycle at their predetermined cycling cadence, for which they were asked to maintain for the entire test. The ramp function for each subject was based on their self-reported endurance fitness, and the need to constrain the test to between 8 and 12 minutes (Astorino et al., 2005; Buchfuhrer et al., 1983; Yoon, Kravitz, & Robergs, 2007) and consequently varied between 25 and 35 W/min. The VO2 ramp protocol consisted of two minutes of rested breathing (to attain a baseline reading), followed by two minutes at double the ramp function Watts, and then followed by a near continuous ramp function (increment at 0.5 Hz). The subjects were also instructed to continue cycling until volitional exhaustion (Astorino, Robergs, Ghiasvand, Marks, & Burns, 2000). The test was terminated once the subject could no longer maintain a pedalling frequency of > 40 rev/min (Astorino et al., 2000). The peak power output for the maximal VO2 ramp test was 341 ± 45 W, and the maximal VO2 was 61.1 ± 7.6 mL.kg.min−1).
Using the breath-by-breath VO2 data collected from the ramp test, the ventilation threshold (VT) of each subject was determined visually by the ventilatory equivalent method (Gaskill et al., 2001) using a custom designed computer program (LabVIEWTM, National Instruments, Austin, TX, USA). The VT was detected by the program through the user directed application of three linear segments to the data. The VT was computed as the time of the intersection between segment 1 (baseline response, slope ∼ 0) and segment 2 (initial deviation from baseline). The VT was then used to determine to cycle ergometer power output required for the eight repeat bouts in each of the three exercise trials. The power output was determined to be the cycle ergometer watts at the time point of the identified VT.
2.3. Exercise protocol
As this study focused in particular on the time to steady-state VO2 response for single and multiple-averaged trials, eight identical square-wave exercise transitions were administered over two separate days. The trial was repeated eight times, as this figure was a recurring maximum that was found within the literature. The exercise protocol involved seated rest for two minutes, then two minutes of unloaded (0 W) cycling, followed by an increase to 85% VT for 6 minutes (ample time for the subject to reach steady-state VO2).
Each subject was fitted for indirect calorimetry and ECG prior to commencement of the exercise trial. A minimum time frame of 48 hours separated the completion of the VO2 ramp test and each subsequent trial day. No more than four exercise bouts were completed in one day (Spencer, Murias, Lamb, Kowalchuk, & Paterson, 2011). Each testing day occurred at approximately the same time of day for that particular subject. The subjects remained seated on a chair between bouts, and only begun the next cycling once their HR had returned to within 10 beats per minute of its rested value, and at least 15 minutes had passed. This timeframe was chosen as past research has indicated that there is no significant effect of prior moderate intensity exercise on VO2 kinetics in subsequent trials (Spencer et al., 2011; Burnley, Jones, Carter, & Doust, 2000; Gerbino, Ward, & Whipp, 1996).
2.4. Data reduction and analysis
Data were processed to support both trial averaging and breath averaging. For trial averaging, raw breath-by-breath data for each of the 8 repeated trials was saved as tab delimited text files from the original custom data acquisition software. Each trial text file was imported in to a commercial graphics and curve-fitting program (Prism, GraphPad Software, La Jolla, CA, USA), and data were removed for the initial rest data collection of each trial. Data were then graphed and the phase-I time delay data were removed for each trial. An additional custom program was written that interpolated (linear segment method) the data of each file to 1 Hz intervals, and then averaged data sets resulting in the first data collected file being the raw data, followed by averages across each of 2, 3, 4, 5, 6, 7 and 8 trials. The data points for each trial were limited to the smallest data set of the 8 repeated trials. An additional custom program was developed to use this interpolated data to compute the mean squared error [Eq. (2)] of each data set to the adopted criterion of the 8-repeated trial average.
 (2)
(2)
The raw breath-by-breath data of the first trial was processed using each of 3, 5, 7, 9, 11 and 13 ‘sliding’ breath averages from custom designed data acquisition software. Rest and phase-I time delay data were then removed as previously explained. This data was also then interpolated to 1 Hz, and the mean squared error was derived for each breath averaged data set compared to the criterion of the 13-breath averaged data.
τ data for the multiple-trial averaging and the multiple-breath averaging was derived from the application of Eq. (1) to all exercise transition data sets, following importation in to Prism software.
2.5. Statistical analyses
Statistical analysis of the data was performed using SPSS (IBM Corporation, New York, NY, USA). The subjects of this study completed a single cycling protocol, which was repeated eight times. The data was processed using eight levels of multiple-trial averaging (single-, 2-, 3-, 4-, 5-, 6-, 7-, 8-trial) and seven levels of multiple-breath averaging (single-, 3-, 5-, 7-, 9-, 11-, 13-breath). The processed data was then modelled by comparing the mean squared error of the averaging to the highest numeric averaged condition; the 8-trial average and the 13-breath averaging for each method, respectively. Differences between the levels of each of the trial and breath-averaged data were run separately using one-way repeated measures analysis of variance (Anova).
For tau, data were analyzed by a two-factor repeated measures Anova (Method [2] × Average [7]). To keep both factors at 7 levels, the 8 trial average data was removed from this analysis. For all analyses, statistical significance was set at p < 0.05. All data are presented as mean ± SD.
3. Results
Figure 1 displays VO2 kinetics data from our study for the same subject performing an identical square-wave exercise test. The data is presented as raw VO2 (a–d), and as a 7-breath average (e–h).
To assess the change in modelling error with increasing averaging we pursued two approaches. First, we treated the 8-trial average and 13-breath average as the criterion methods and then quantified the change in error with each increment averaging function. Second, we used the mono-exponential fit of the single-breath raw data as the criterion.
For the mean trial-averaged data in Figure 2, the mean squared error decreased significantly (main effect, p = 0.001) with each subsequent average (single-, 2-, 3-, 4-, 5-, 6-, and 7-trial), and as explained in Methods, with the 8-trial averaged data set as the criterion. However, the reduction in error from the 3-trial averaging represented 68% of the total error reduction of the 7 trial average, and arguably could be interpreted that any further error reduction after the 3-trial average was no longer meaningful.
Similar mean squared error results to the trial-averaged data can be seen with the mean multiple-breath averaged data (Fig. 3). The mean squared error decreased significantly (main effect p = 0.01) with each subsequent average (single-, 3-, 5-, 7-, 9-, and 11-breath) with the 13-breath averaged data set as the criterion. Similar to the trial averaged error data, the 3-breath average causes a 70% reduction in error, with further breath averaging able to be interpreted to cause no further meaningful reduction in error.
For τ data (Fig. 4), the Method × Average interaction was highly significant (p = 0.008), where τ trended to increase beyond 3-breath averages and decrease from 1 to 3 trial averages.
 |
Fig. 1 Data from a single subject completing identical exercise transitions during one testing session from unloaded (0 W) cycling to ∼85% VT (244 W). The data is presented as raw VO2 (a-d), and as a 7-breath average (e-h). Differing overall VO2 kinetics can be seen across all data sets, despite the fact that the exercise intensities are identical. |
 |
Fig. 2 Mean squared error of the raw and 1-s interpolated data for all multiple-trial average data, with 8-trial average as the criterion. |
 |
Fig. 3 Mean squared error of the raw and multiple-breath average, with 13-breath trial as the criterion. |
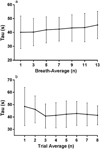 |
Fig. 4 Mean ± SD values for tau for: a: breath averaged data and; b: trial averaged data. |
4. Discussion
Breath-by-breath fluctuations are a result of a number of factors, however, most commonly produced by acute changes in oxygen due to ventilation differences in breath-by-breath systems. Therefore, it is an arguably sound method to process VO2 kinetics data (particularly that which is breath-by-breath) using data averaging to increase the signal-noise ratio. It was argued by Whipp et al. (1982) that averaging the breath-by-breath data using a multiple-trial averaging method permitted the mono-exponential model’s pattern to be more easily discernible as the inter-breath fluctuations are reduced. Lamarra, Whipp, Ward, and Wasserman (1987) affirmed the inherent irregularities of breathing that produce breath-to-breath fluctuations, and attempted to quantify the influence of these fluctuations on the precision of estimating the kinetic parameters of gas exchange models currently in use. Unfortunately, these authors only statistically compared single trial data to the 8 repeated trial average. Furthermore, no data of the error of the single to 8 trial criterion were presented. Nevertheless, numerical simulation revealed that between 3 to 8 repeated trials would be needed to lower the 95% confidence interval of the trial to trial variability in τ to < ± 2 s. Recently, Spencer et al. (2011) studied the kinetic effects of serial moderate-intensity exercise transitions over a single day. The authors reported no further reduction in the reproducibility of 95% confidence intervals when averaging more than 3 exercise transitions. However, Spencer et al. (2011) only assessed progressive reduction in the reproducibility of 95% confident interval using 1, 2, 3, 4, and 6 repeated exercise transitions, nor did they statistically assess the change in their trial-based error between each of the conditions.
In this research, we compared different methods of VO2 kinetics data collection and post-acquisition processing. In particular, we assessed single vs. multiple-trial data averaging, as well as raw vs. multiple-breath averaging.
4.1. Multiple-trial averaging
This method of modelling has been used extensively in the literature since the 1970’s (Koppo, Bouckaert, & Jones, 2004; Linnarsson, 1974; Rossiter et al., 1999; Spencer et al., 2012; Whipp, 1971; Whipp et al., 1982). Although the literature describes variations of this method of data processing, which are defined further by Keir, Murias, Paterson, and Kowalchuk (2014), the method discussed in this study appears to be the most commonly used and was therefore chosen for comparison. Keir et al. (2014) also reported this averaging method yielded the narrowest confidence interval, when compared to other processing methods that were investigated.
Multiple-trial averaging was proposed to lessen the breath-by-breath fluctuations and noise apparently associated with single-trial VO2 kinetics (Lamarra et al., 1987; Whipp et al., 1982). Under this pretence, an individual’s underlying kinetic response to a sub-VT exercise increment is assumed to be nearly identical across all repeat trials. Our results indicated the contrary. Although the final steady-state VO2 of a subject across multiple trials were similar, often the response kinetics of all three phases were not (Figs. 2 and 3). As can be seen from these figures, the phase-II kinetics (and in particular, the initial onset segment of phase-II) are quite variable between the methodologically identical data sets.
It is in the opinion of the authors that the use of multiple-trial averaging, to yield a singular kinetic response, could potentially be masking underlying kinetic behaviour in exercise transitions to steady-state. It has been argued by Stirling, Zakynthinaki, and Saltin (2005) that the high frequency breath by breath data isn’t Gaussian, as suggested elsewhere (Lamarra et al., 1987; Rossiter et al., 1999), but rather representative of physiological function. We also share this view, and believe that processing these apparently ‘noisy’ data sets may in fact be oversimplifying the underlying kinetics of the VO2 response. It should also be reported here that Gimenez and Busso (2008) concluded that an algorithm developed by Busso and Robbins (1997) could reduce breath-by-breath variability in the VO2 kinetic response during moderate and heavy exercise transitions, thereby potentially alleviating a need for repeated exercise trials. However, the scope of this study is purely to assess different levels of multiple-trial and multiple-breath averages, and make recommendations. Ideally, the past work of Gimenez and Busso (2008) and Spencer et al. (2011), along with this study, could potentially re-shape how VO2 kinetics data is collected and processed.
Our results indicated that the decrease in mean-squared error, when compared against an 8-trial data average, provided limited benefit following three repeat averages. This is in-line with findings reported by Spencer et al. (2011). Furthermore, minimal guidelines specifically addressing multiple-trial average repeated transition numbers have been published for use across research projects. This raises several concerns. Firstly, studies that differ in repeat trial averaging are at increased probability for altered responses caused by differences in data processing and not true VO2 kinetics. Secondly, exposing research participants to superfluous repeated bouts of exercise (in particular heavy and/or severe exercise) may not be necessary for complete data. Thirdly, it remains unknown whether multiple test averaging adds error to the mean response, for with each test is added opportunity for experimenter error, equipment error, and repeat test biological variability. Lastly, with an increasing number of exercise repetitions comes an increase in costs, use of laboratory equipment, and time needed to complete a study. It is in the best interest of all researchers and institutions the keep the expenditure of these resources to a minimum when they provide no improvement to the internal validity of research measurement.
Finally, there is also published criticism of the trial averaging method of data processing. For example, Stirling et al. (2005) proposed a new model of VO2 kinetics in response to exercise. Part of their reassessment of the processing methods focused on repeat trial averaging. The authors claimed that treating the breath-by-breath data oscillations as noise (or variability that should be removed) is over-simplifying the response, as the oscillations contain physiological features of the signal; not simply system or device noise (Stirling et al., 2005). Further to this, Stirling et al. (2005) stated that modelling a 3-phase response when it only occurs following averaging, may not be correct, as the response may then be more a result of trial averaging than true physiology.
It should be mentioned here that with multiple identical exercise transitions occurring over multiple days (more likely with higher repetition numbers), there are concerns of day-to-day variability affecting VO2 measures as well as other recorded variables. Steps were taken in this study to minimise this variability where possible. These included having the participant complete the trials at the same time each day. As well, laboratory temperature and humidity were accounted for, and gas analyser calibration was particularly stringent.
4.2. Multiple-breath averaging
Breath averaging has also been used to reduce error when processing VO2 data (Robergs & Burnett, 2003). Our results indicated that the decrease in mean squared error, when compared against a 13-breath data average, showed significance for each trial. However, significance became less meaningful at averages greater than 3 breaths. From this, we argue that the VO2 data should not be averaged by more than a 3-breath average.
During its use in VO2 kinetics processing (more-so prior to 1982), multiple-breath averaging was used to smooth VO2 data to help plot the time course from an initial steady-state to a new steady-state (Diamond et al., 1977; Hagberg et al., 1980). However, modern data acquisition and processing software and equipment allows far more precise data collection and interpretation. Currently, raw single-breath VO2 data can be processed with using a mono-exponential function without using a multiple-breath average. With regard to the minimization of error, due to the increasing accuracy of software and equipment and the breath-by-breath data collection, raw VO2 data from exercise trials can attain in excess of 300 data points. Furthermore, from the application of fundamental mathematics, the large data sets remove any rationale for the need to remove breath-by-breath error. Such data sets can be adequately handled by current software curve fitting programs and have the potential to be processed with new, more suitable methods. These potential methods are discussed further by Stirling et al. (2005) and McNulty et al. (2015).
4.3. Mono-exponential assessment
Common to both breath-by-breath or trial-averaged VO2 data processing is using a mono-exponential equation [Eq. (1)] for modelling the data for phase-II of the response (Whipp, 1971). Although this model has been used in the majority of VO2 kinetics to steady-state research (Barstow and Mole, 1991; Di Prampero, Mahler, Giezendanner, & Cerretelli, 1989; Wisen & Wohlfart, 2004), its basis of predicting phase-II kinetic behaviour has been considered questionable within some experimentation (Brittain, Rossiter, Kowalchuk, & Whipp, 2001; Hughson & Morrissey, 1982; Koppo et al., 2004; McNulty et al., 2015). It has also been criticized as a vast over-simplification of the physiological response to steady-state exercise (McNulty et al., 2015; Stirling et al., 2005).
The response of τ to breath or trial averaging was interesting. Beyond the 3-breath average, there was a trend for tau to increase, but for trial averaging, tau decreased from 1-3 trial averages, and then remained stable. τ was similar between breath and trial averaging. As such, a 3-breath average is comparable to a 3-trial average for the assessment of τ, but is obviously more cost effective and less demanding on research subjects. The initial reduction in τ with increasing trial averaging to 3-trials is more difficult to interpret. Our interpretation is that the change in τ in this instance is artificial and that a −trial average is over-processing given that τ remains unchanged through to an 8-trial average. Carlo, Michela, and Silvia (2011) compared different algorithms for removing biological variability in breath-by-breath VO2 data, however, more research needs to be completed to ascertain the validity of the need for data variability reduction prior to modelling VO2 data for kinetics analyses.
4.4. Trial and breath averaging vs. raw
Given that the prior results of this study revealed the suitability of both 3-trial and 3-breath averaging from a mean square error reduction perspective, we also compared the error reduction of a 3-trial average and a 3-breath average from raw data fitted with the mono-exponential equation. Although there was a significant reduction in error from raw data to the 3-trial and 3-breath average, there was no significant error difference between the three processing methods. As well as this, there was no difference in the kinetic response between the raw and the 3-trial and 3-breath average. This preliminary finding supports our earlier comments of the unnecessary nature, and potential altering of kinetics, of data averaging. Modern developments in VO2 data acquisition and processing software and hardware allow researchers to deal with data at its fundamental level. There appears to be no need to average data, using either method, but rather carefully acquire raw data that has been acquired using a high quality metabolic system. Unfortunately, the requirements of a metabolic system that suit breath-by-breath expired gas analysis remains undetermined, other than to exclude traditional systems that have a constant volume mixing chamber located at the end of a length of expired tubing (Robergs, Dwyer, & Astorino, 2010).
5. Conclusions
Multiple-trial and multiple-breath averaging have been used extensively in VO2 kinetics data processing for many years. Although there has been some research comparing methods of processing, no definitive decision has been made amongst researchers as to what level of averaging is required to process data. The results of this study showed the application of either a 3-trial or 3-breath average to the VO2 data allowed for sufficient error reduction, and that no further averaging would be meaningful. However, these results do not address the issue of whether there is a need to average data at all, especially with advancements in hardware and software since these averaging methods were first introduced.
Limitations
There are a number of key limitations identified within this study. Firstly, only a single exercise transition from an unloaded baseline of cycling was selected. Therefore, the recommendations within this paper should only apply to single transition VO2 data averaging, until multiple transitions are similarly assessed. Secondly, a workload transition of 85% of VT was selected, and no other. As an exercise transition approaches VT, there is a relative increase in breathing frequency which will determine the quantity of VO2 data points when using a breath-by-breath VO2 system. Although likely not substantial (as breathing frequency is still relatively low at sub-threshold exercise bouts), this could have an impact on the results of the two averaging systems (particularly the breath-by-breath system). Thirdly, only a mode of cycling was selected for the exercise testing.
Statement of contribution
C.M. was responsible for study design, subject recruitment, data collection, data analysis, and manuscript production.
R.R. was responsible for study design, data analysis, and manuscript editing.
References
- Astorino, T.A., Robergs, R.A., Ghiasvand, F., Marks, D., & Burns, S. (2000). Incidence of the oxygen plateau during exercise testing to volitional fatigue. Journal of Exercise Physiolology online , 3(4), 1–12. [Google Scholar]
- Astorino, T.A., Willey, J., Kinnahan, J., Larsson, S.M., Welch, H., & Dalleck, L.C. (2005). Elucidating determinants of the plateau in oxygen consumption at VO2MAX. British Journal of Sports Medicine , 39, 655–660. [CrossRef] [PubMed] [Google Scholar]
- Barstow, T.J., & Mole, P. (1991). Linear and non-linear characteristics of oxygen uptake kinetics during heavy exercise. Journal of Applied Physiology , 71(6), 2099–2106. [CrossRef] [PubMed] [Google Scholar]
- Barstow, T.J., Casaburi, R.R., & Wasserman, K.K. (1993). O2 uptake kinetics and the O2 deficit as related to exercise intensity and blood lactate. Journal of Applied Physiology , 75(2), 755–762. [CrossRef] [PubMed] [Google Scholar]
- Brittain, C.J., Rossiter, H.B., Kowalchuk, J.M., & Whipp, B.J. (2001). Effect of prior metabolic rate on the kinetics of oxygen uptake during moderate-intensity exercise. European Journal of Applied Physiology , 86(2), 125–134. [CrossRef] [PubMed] [Google Scholar]
- Buchfuhrer, M.J., Hansen, J.E., Robinson, T.E., Sue, D.Y., Wasserman, K., & Whipp, B.J. (1983). Optimizing the exercise protocol for cardiopulmonary assessment. Journal of Applied Physiology , 55(5), 1558–1564. [CrossRef] [PubMed] [Google Scholar]
- Burnley, M., Jones, A.M., Carter, H., & Doust, J.H. (2000). Effects of prior heavy exercise on phase II pulmonary oxygen uptake kinetics during heavy exercise. Journal of Applied Physiology , 89(4), 1387–1396. [CrossRef] [PubMed] [Google Scholar]
- Busso, T., & Robbins, P.A. (1997). Evaluation of estimates of alveolar gas exchange by using a tidally ventilated nonhomogenous lung model. Journal of Applied Physiology , 82(6), 1963–1971. [CrossRef] [PubMed] [Google Scholar]
- Carlo, C., Michela, C., & Silvia, P. (2011). Algorithms, modelling and VO2 kinetics. European Journal of Applied Physiology , 111(3), 331–342. [Google Scholar]
- Carter, H., Pringle, J.S.M., Jones, A.M., & Doust, J.H. (2002). Oxygen uptake kinetics during treadmill running across exercise intensity domains. European Journal of Applied Physiology , 86(4), 347–354. [CrossRef] [PubMed] [Google Scholar]
- Diamond, L.B., Casaburi, R., Wasserman, K., & Whipp, B.J. (1977). Kinetics of gas exchange and ventilation in transitions from rest or prior exercise. Journal of Applied Physiology , 43(4), 704–708. [CrossRef] [PubMed] [Google Scholar]
- Di Prampero, P.E., Mahler, P.B., Giezendanner, D., & Cerretelli, P. (1989). Effects of priming exercise on VO2 kinetics and O2 deficit at the onset of stepping and cycling. Journal of Applied Physiology , 66(5), 2023–2031. [CrossRef] [PubMed] [Google Scholar]
- Exercise & Sports Science Australia. (2011). (https://www.essa.org.au/wp-content/uploads/2011/09/Screen-tool-version-v1.1.pdf). [Google Scholar]
- Gaskill, S.E., Ruby, B.C., Walker, A.J., Sanchez, G.A., Serfass, R.C., & Leon, A.S. (2001). Validity and reliability of combining three methods to determine ventilatory threshold. Medicine and Science in Sport and Exercise , 33(11), 1841–1848. [CrossRef] [Google Scholar]
- Gerbino, A., Ward, S.A., & Whipp, B.J. (1996). Effects of prior exercise on pulmonary gas-exchange kinetics during high-intensity exercise in humans. Journal of Applied Physiology , 80(1), 99–107. [CrossRef] [PubMed] [Google Scholar]
- Gimenez, P., & Busso, T. (2008). Implications of breath-by-breath oxygen uptake determination on kinetics assessment during exercise. Respiratory Physiology and Neurobiology , 162(3), 238–241. [CrossRef] [Google Scholar]
- Hagberg, J.M., Hickson, R.C., Ehsani, A.A., & Holloszy, J.O. (1980). Faster adjustment to and recovery from submaximal exercise in a trained state. Journal of Applied Physiology , 48(2), 218–224. [CrossRef] [PubMed] [Google Scholar]
- Hickson, R.C., Bomze, H.A., & Holloszy, J.O. (1978). Faster adjustment of O2 uptake to the energy requirement of exercise in the trained state. Journal of Applied Physiology , 44(6), 877–881. [CrossRef] [PubMed] [Google Scholar]
- Hughson, R.L., & Morrissey, M. (1982). Delayed kinetics of respiratory gas exchange in the transition from prior exercise. Journal of Applied Physiology , 52(4), 921–929. [CrossRef] [PubMed] [Google Scholar]
- Keir, D.A., Murias, J.M., Paterson, D.H., & Kowalchuck, J.M. (2014). Breath-by-breath pulmonary O2 uptake kinetics: effect of data processing on confidence in estimating model parameters. Experimental Physiology , 99(11), 1511–1522. [CrossRef] [PubMed] [Google Scholar]
- Koppo, K., Bouckaert, J., & Jones, A. (2004). Effects of training status and exercise intensity on phase II VO2 kinetics. Medicine and Science in Sport and Exercise , 36(2), 225–232. [CrossRef] [Google Scholar]
- Lamarra, N., Whipp, B.J., Ward, S.A., & Wasserman, K. (1987). Effect of interbreath fluctuations on characterizing exercise gas exchange. Journal of Applied Physiology , 62(5), 2003–2012. [CrossRef] [PubMed] [Google Scholar]
- Linnarsson, D. (1974). Dynamics of pulmonary gas exchange and heart rate changes at start and end of exercise. Acta Physiologica Scandinavia , 415, 1–68. [Google Scholar]
- McNulty, C.R., Robergs, R.A., & Morris, D. (2015). Influence of increment magnitude and exercise intensity on VO2 kinetics, time to steady state, and muscle oxygenation. Journal of Exercise Physiology online , 18(5), 37–58. [Google Scholar]
- Robergs, R.A., & Burnett, A.F. (2003). Methods used to process data from indirect calorimetry and their application to VO2max. Journal of Exercise Physiology online , 6(2), 44–57. [Google Scholar]
- Robergs, R.A., Dwyer, D., & Astorino, T. (2010). Recommendations for improved data processing from expired gas analysis indirect calorimetry. Sports Medicine , 40(2), 1–17. [CrossRef] [Google Scholar]
- Rossiter, H.B., Ward, S.A., Doyle, V.L., Howe, F.A., Griffiths, J.R., & Whipp, B.J. (1999). Inferences from pulmonary O2 uptake with respect to intramuscular [phosphocreatine] kinetics during moderate exercise in humans. Journal of Physiology , 518(3), 921–932. [CrossRef] [Google Scholar]
- Spencer, M.D., Murias, J.M., Grey, T.M., & Paterson, D.H. (2012). Regulation of VO2 kinetics by O2 delivery: insights from acute hypoxia and heavy-intensity priming exercise in young men. Journal of Applied Physiology , 112(6), 1023–1032. [CrossRef] [PubMed] [Google Scholar]
- Spencer, M.D., Murias, J.M., Lamb, H.P., Kowalchuk, J.M., & Paterson, D.H. (2011). Are the parameters of VO2, heart rate and muscle deoxygenation kinetics affect by serial moderate-intensity exercise transitions in a single day? European Journal of Applied Physiology , 111(4), 591–600. [CrossRef] [PubMed] [Google Scholar]
- Stirling, J.R., Zakynthinaki, M.S., & Saltin, B. (2005). A model of oxygen uptake kinetics in response to exercise: including a means of calculating oxygen demand/deficit/debt. Bulletin of Mathematical Biology , 67(5), 989–1015. [CrossRef] [PubMed] [Google Scholar]
- Whipp, B.J. (1971). Rate constant for the kinetics of oxygen uptake during light exercise. Journal of Applied Physiology , 30(2), 261–263. [CrossRef] [PubMed] [Google Scholar]
- Whipp, B.J., Ward, S.A., Lamarra, N., Davis, J.A., & Wasserman, K. (1982). Parameters of ventilatory and gas exchange dynamics during exercise. Journal of Applied Physiology , 52(6), 1506–1513. [CrossRef] [PubMed] [Google Scholar]
- Wisen, A., & Wohlfart, B. (2004). Determination of both the time constant of VO2 and ΔVO2/ΔW from a single incremental exercise test: validation and repeatability. Clinical Physiology and Functional Imaging , 24, 257–265. [CrossRef] [PubMed] [Google Scholar]
- Yoon, B.K., Kravitz, L., & Robergs, R. (2007). VO2max, protocol duration, and the VO2 plateau. Medicine and Science in Sport and Exercise , 39(7), 1186–1192. [CrossRef] [Google Scholar]
Cite this article as: McNulty CR & Robergs RA (2019) Repeat trial and breath averaging: Recommendations for research of VO2 kinetics of exercise transitions to steady-state. Mov Sport Sci/Sci Mot, 106, 37–44
All Figures
|
Fig. 1 Data from a single subject completing identical exercise transitions during one testing session from unloaded (0 W) cycling to ∼85% VT (244 W). The data is presented as raw VO2 (a-d), and as a 7-breath average (e-h). Differing overall VO2 kinetics can be seen across all data sets, despite the fact that the exercise intensities are identical. |
| In the text | |
|
Fig. 2 Mean squared error of the raw and 1-s interpolated data for all multiple-trial average data, with 8-trial average as the criterion. |
| In the text | |
|
Fig. 3 Mean squared error of the raw and multiple-breath average, with 13-breath trial as the criterion. |
| In the text | |
|
Fig. 4 Mean ± SD values for tau for: a: breath averaged data and; b: trial averaged data. |
| In the text | |
Current usage metrics show cumulative count of Article Views (full-text article views including HTML views, PDF and ePub downloads, according to the available data) and Abstracts Views on Vision4Press platform.
Data correspond to usage on the plateform after 2015. The current usage metrics is available 48-96 hours after online publication and is updated daily on week days.
Initial download of the metrics may take a while.